


Focus Population
Focus
Population
National
Ending the HIV Epidemic (EHE) Indicators
Learn more about the 6 EHE indicators.
Note: Most recent annual data from the CDC HIV Surveillance System is displayed above. Data is from 2022 or 2024 depending on the indicator.
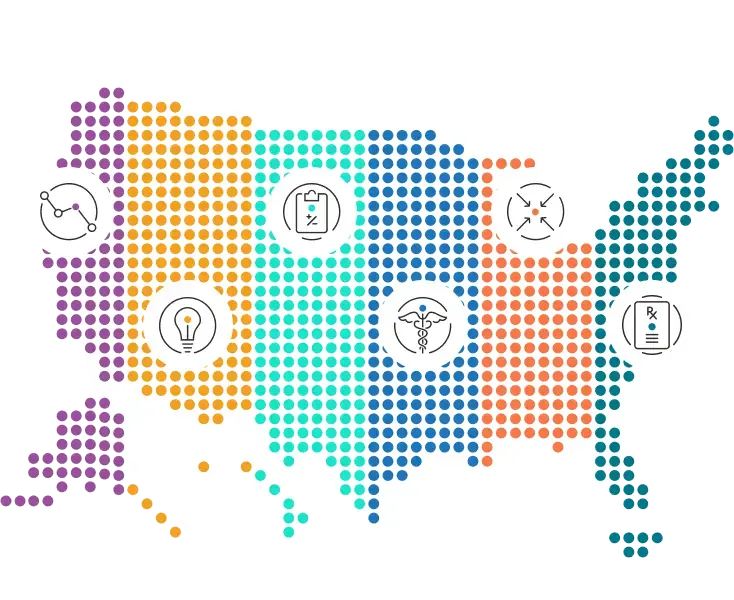
U.S. Tile Map
Estimated rate of new HIV infections (including both diagnosed and undiagnosed infections) per 100,000 people
Legend per 100,000
No Data
Indicator Progress Tracker
Estimated rate of new HIV infections (including both diagnosed and undiagnosed infections) per 100,000 people
National
Change in incidence from 2017 to 2022 in National EHE Jurisdictions
2017
2018
2019
2020*
2021
2022
2023
2024
2017
2022
Unavailable Year
Desired
* COVID-19 pandemic
Data last updated: